Oracle
What Is Oracle?
Oracle is a multinational software corporation and one of the largest players in the IT enterprise solution market. They are famous for developing the Oracle database. This database is a relational database management system that is used for grid computing. This allows a very cost-effective method for handling information.
It also supports handling of large databases, analytics, and business intelligence. They have expanded their market and now develop many other applications such as data storage equipment, data analysis tools, and middleware.
In 2018, Oracle is the third largest software development company by revenue and has a market share of more than 40%. They are in the process of developing cloud applications for the future.
History of Oracle
The company was co-founded by Larry Ellison along with Bob Miner and Ed Oates, and the initial name of the company was Software Development Laboratories. Ellison was inspired by a paper authored by Edgar F. Codd on relational database management systems and the IBM System R.
The first SQL database Relational Database Management system was launched in 1979. In 1984, the first database with read consistency was deployed.
In 1986, the company launched the first client-server database management system, and in the subsequent years, they launched PL/SQL and UNIX based applications. They formally changed their name to Oracle Corporation.
At that time co-founder, Bob Miner was the senior programmer. Their early products were made using the C programming language.
Edition of Oracle
These are six editions of Oracle:
- Enterprise edition – It is the most robust version of the database system with high scalability, performance, and security required for handling critical applications such as online transactional processing.
- Express edition – It is a lightweight, entry-level and free edition of the software. It is easy to download, install and run. It is easier to migrate to other editions and can be installed on a system that has multiple CPUs that can have any size, through a single CPU on the host machine. It can store 11 GB of the user’s data.
- Standard Edition One – This edition is used for handling all types of database tasks, in small business environments and large scale corporations. It offers ease of use, high performance, accessibility, and web applications. Workgroups can be organized easily while using these editions.
- Oracle Lite – The edition is built for mobile devices and is used to connect the databases with mobile applications. It helps in handling remote applications, device management, and data synchronization.
- Oracle Standard edition – This edition provides similar features that the Standard Edition One provides. It provides support for larger systems and Oracle Real Application Clusters (Oracle RAC).
- Oracle Personal edition – The personal edition provides an application deployment environment and development platform. This is available only on Linux and Windows.
Architecture of Oracle Database
The architecture of the Oracle database is described as follows:
- Database - A database consists of one instance and a database. The different processes and memory are handled by the instance. The physical data files are within the database. When a database is started, the SGA (System Global Area) is assigned to the background processes.
- Instance – An instance is a combination of the different memory buffers and background processes.
- Database server - The database is used to store and obtain the information. The database server is used to handle all the data related tasks. It manages the data so that multiple users can have access to the data concurrently. It also helps in the prevention of unauthorized access to the data and helps in the system recovery.
- Listener – The listener is used to develop a channel between the client process and the database instance. It is a database server process that receives the client requests, connects it to the instance and provides the connection to the process.
Why Opt for Oracle?
Oracle is a very popular choice for users and companies all over the world due to the following reasons:
1) Enhanced system upgrades – As Oracle databases are backwards compatible, the companies are able to upgrade their entire database systems easily. Oracle provides low-cost upgrading facilities and the entire system does not have to be altered.
2) Data recovery – The Oracle database implements a technology called Flashback that helps in securing lost data. This technology enhances data recovery time and human error. This simplifies the administration.
3) Enhanced features – The Real Application Cluster feature of the Oracle database allows multiple servers to work on a single database. This enhances the processing power of the database. There are options to fine-tune the database to synchronize it with the server.
4) Versatility – The database is very versatile as to choosing the operating system to run it. It can be run on any operating system such as Windows and UNIX. For example, the Oracle SQL database can be installed in a UNIX system, while the standardization of the SQL can be preserved. As UNIX is not much vulnerable to viruses, the user can use this to their advantage.
5) Version changes – Oracle has very updated notifications that inform you of the details about the next version to be released and its new features. It has good documentation along with a very active community where users can discuss the issues.
Conclusion
The different features of Oracle along with its versatility make it a major name in the database software industry. The database is portable and can be used in different operating systems with ease. The enhanced technologies enable users to recover their data faster and reduce the chances of data loss. As Oracle Corporation is the largest developer of database technologies, they have the potential to spend more on research and development, which in turn allows them to develop advanced products. Their customer support is also very strong and the issues are resolved efficiently.
Tutorials
 Difference between Oracle 10g and 11g and 12c Database
Differences between Oracle 11g and Oracle 12c Basis of differentiation Oracle 11G Oracle 12C Indexing It is possible to create just a single index on any o ...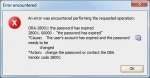 Error ORA-28001: the password has expired, during System Startup
you are getting this error because of resource PASSWORD_LIFE_TIME from the profile which is generally set to 180 days.To resolve the error please do as following:Check the database owner with the foll ... Difference between Primary Index, Secondary Index and Clustered Index
Primary Index vs. Secondary Index vs. Clustered IndexHello Experts,Is there any one who can tell me what is the exact difference between Primary index & Secondary index and clustered index?Please ...- BR*TOOLS and SAP DBA
1. What are BR*TOOLS and SAPDBA?BR*TOOLS and SAPDBA are utility programs for Oracle administration that are developed by SAP. BR*TOOLS are increasingly replacing SAPDBA functions.2. What BR*TOOLS are ... - Oracle SIDs vs. Oracle SERVICE NAMES
What is sid in Oracle Oracle SID is the unique name that uniquely identifies your instance/database, whereas the Service name is the TNS alias that you give when you remotely connect to your databa ... - Installing the Corrected MS SQL Server Collation
When installing the MS SQL Server 2000 database for an SAP system, for "Collation Settings" we recommend to select "Binary order for use with the 850 Multilingual Character Set" (c ... - List of Oracle Database 10g Patch Set
10.2.0.2You must install at least Oracle patch set 10.2.0.2 if you want to use Oracle 10.2 in the SAP environment. In addition, apply the patches specified in this description. All patches currently r ... - SAP System under Microsoft Cluster Server (MSCS)
This note contains a collection of the most frequently asked questions and problems during the installation and the operation of an SAP System under Microsoft Cluster Server (MSCS). 1. Message: T ...  ORA-01455: converting column overflows integer datatype
ORA-01455 error in program SMIGR_CREATE_DDOn oracle database, while running the program SMIGR_CREATE_DD we get an error likes Error while creating DDSTORAGE entries for table <TABLE_NAME> Failed ...- What is SAP Oracle, Course, Career and Certification?
Definition - What is SAP Oracle?In the past few years, SAP and Oracle have worked in a coordinated way to provide their customers with the popular SAP/ Oracle environment, with SAP applications s ...  Difference Between Hot Backup and Cold Backup
What is Hot Backup? Hot backup is also called online or dynamic backup, and it is performed nearly 24 hours every day as long as the system is still running. Meanwhile, new data will be generated c ...- What does 'SNIPED' status in v$session mean?
When IDLE_TIME is set in the users' profiles or the default profile. This will kill the sessions in the database (status in v$session now becomes SNIPED) and they will eventually disconnect. It does n ... - How to find the datafile which contains a particular table?
If you query DBA_EXTENTS based on segment_name equal to your table name you will see that the column FILE_ID will show you the database file where each extent is located. You can then use FILE_ID to q ... - Perform Consistency check of ORACLE database
How to Perform Consistency check of ORACLE database?Consistency check is used from time to time for a complete confirmation that there is no corruption in a complete database and also to discover any ... - MRP is Not Applying for the Archived Logs
MRP is not applying the archived logs because one of the archived log got corrupted in standby before applying. Same archivelog is missing in primary too.However tried to perform an incremental backup ...  Difference between ROWID and ROWNUM
What is ROWID in SQL ROWID is a pseudo column in a table in Oracle that stores and returns row addresses in HEXADECIMAL format with database tables. ROWID is the permanent unique identifier fo ...- Difference between RMAN and BRTOOLS?
RMAN (Recovery Manager) and BRTOOLS are tools used for Oracle database administration, but they serve different purposes, here are some basic differences between RMAN and BRTOOLS. ... - What is SQL Patch in Oracle
Oracle SQL Patch also referred to as 'SQL Patch' is a way of fixing the execution plan of a specific SQL statement with the help of a 'full hint'. The SQL Patch makes it possible to ... - Oracle database unexpected growth in non ABAP environment
The user has observed a fairly fast and an unexpected growth in an oracle database which runs on the JAVA ONLY system. The issue can be due to various different reasons, please refer to the example ... - Difference between Oracle Coalesce and Index Rebuild
Oracle, one of the leading database management systems, provides two commonly used methods for index maintenance: the COALESCE statement and the REBUILD statement. Each method has its own benefits and ...