SAP Solution Manager
What is SAP Solution Manager?
SAP Solution Manager, better known as SAP SM, is a robust management solution that brings together various tools, content and direct access to SAP. It supervises and efficiently handles organizational processes, ranging from deployment to solution monitoring. This solution helps in optimizing core business processes and facilitates technical support for different distributed systems and IT infrastructure.
SAP Solution Manager collaborates lines of business and IT aspects of an organization, thereby easing the communication channels between the IT department and rest of the business. This centralized solution supports SAP and non-SAP software, inclusive of future SAP releases as well. Businesses can derive maximum advantage through their IT investments in this SAP environment.
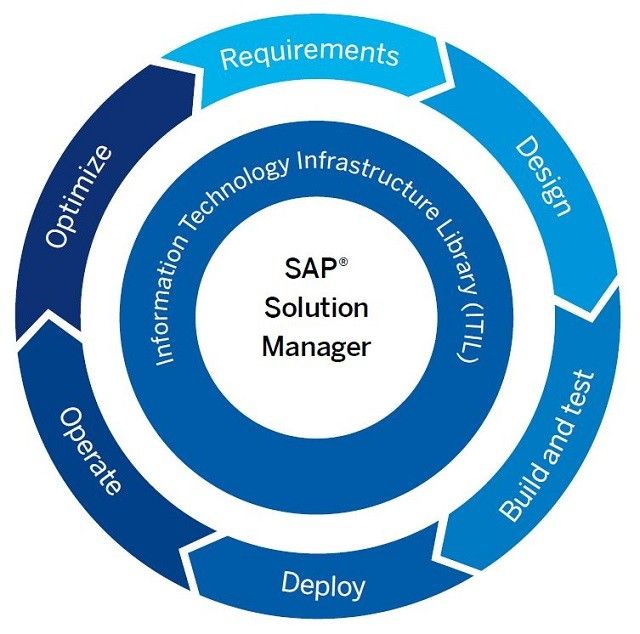
Solution Manager is a centralized support and system management suite. An SAP system landscape may include a large quantity of system installations of SAP systems. SAP Solution Manager tries to reduce and centralize the management of these systems.
In such a landscape,SAP Solution Manager is the managing system, and the business suite applications (e.g. CRM) are the managed systems.
The current version of Solution Manager is Solution Manager 7.0 Enhancement Package 1.
Solution Manager provides an extensive set of features in the IT Support area for enhancing, automating and improving the management of SAP systems:
- Central System Administration
- Project Management
- Test Management
- System Monitoring
- Business Process Monitoring
- E2E Root Cause Analysis
- IT Technical Reporting
- Centralized Alerting
- Installation Keys
- Early Watch Reporting
- Change Management (Change Request Management & Maintenance Optimizer)
- Service Desk
SAP is actively improving and extending all the areas, so this list may be outdated very quickly.
SAP Solution Manager is the successor to ASAP ValueSAP. SAP Solution Manager helps in implementing and managing complex system landscapes. Globally systems are being distributed across geographies and business processes cover more than one system. In such complex scenarios, integrating technical and business requirements is important for the success of IT. SAP Solution Manager provides SAP customers with an efficient means of handling both the technical and business process side of solution implementation.
As part of SAP Solution Management Solutions, the customers receive best practices relating to:
- Global Strategy and Service Level Management
- Business Process Management
- Management of MySAP Technology
- Software Change Management
- Support Desk Management
SAP delivers this using support programs during implementation of the system solution. Some of the benefits of using SAP's Solution Manager are that it helps:
- Manages the technical risk associated with the implementation of the solution ensuring technical robustness
- Helps leverage users core competencies in implementing solutions
- Ensures solution works as intended with best practices built in.
Scope and Opportunity of a Career in SAP Solution Manager
A career in SAP SM provides countless opportunities for all certified candidates. With SAP SM modules in place, they get a chance to help organizations attain high value through their software investment with this certification. Their responsibilities would include the facilitation of technical support for distributed systems, optimization of various business solutions in an efficient manner, and deployment/operations of different SAP solutions.
The salary package for such positions is quite high and increases through the years. Being certified in SAP SM enables ones to be an expert in all things related to SAP solutions.
Become a Certified SAP Solution Manager Consultant
The first step to receive a certification as a SAP Solution Manager is getting all the basics of SAP solutions clear. This module paves the way for one to be an expert in SAP SM and eventually become a consultant who can work alongside various companies and help them reach their goals.
The testing of expertise in the field is done through a computer based exam lasting about 180 minutes. It comprises of 80 questions which are mostly multiple choice questions. There are no negative marking for incorrect answers and some may have more than one correct answer. The average pass percentage is 65%, however it can vary.
Candidates can try out three types of certifications: associate, professional and masters. Once this exam is cleared, the candidate gets certified after which he/she can pursue a bright career as a consultant.
Read Next
SAP Solution Manager Module Certification Cost and Course Duration in India
Tutorials
.jpg) System Landscape: Create Logical Components, Solution Manager
System Landscape: Create Logical Components, Solution Manager
System Landscape: Create Logical Components, Solution ManagerThe “System Landscape: Create Logical Components” tutorial.After completing the session you will have a good overview of: Creat ...- Error calling the SAP back-end system
ProblemThe system displays the message "Error during call of SAP back end system (see long text)". The long text contains the following text as additional information: "Name or password ...  EWA Scheduling and Processing Workflow Troubleshooting Steps
Here you can know more about the EWA workflow and basic steps to troubleshoot it.SolutionThe EWAs generated in your solution manager go through a certain process that consists of the followi ....jpg) Service Level Reporting with in the SAP Solution Manager
Service Level Reporting with in the SAP Solution Manager
Service Level Reporting with in the SAP Solution Manager SL Reporting with in the SAP Solution Manager The following demonstration shows how your solution support organization can use the SAP Solu ....jpg) How to handover projects in to operations mode with the SAP Solution Manager
How to handover projects in to operations mode with the SAP Solution Manager
How to handover projects in to operations mode with the SAP Solution ManagerI will guide you through this tutorial. You will get an overview on how to handover projects in to operations mode with the ....jpg) How to handle Customizing Distribution
How to handle Customizing Distribution
How to handle Customizing DistributionCustomizing DistributionWelcome to the tutorial on the Customizing Distribution. In this session you will get an overview of the tools that might assist you will ...- SAP Solution Manager - Monitoring of database clusters
You want to connect database cluster solutions to your SAP Solution Manager 7.1. This SAP Note provides additional setup instructions. Database cluster solutions are: Shared Disk Failover Clus ... - SAP Solution Manager key for SAP Installation
Here is the list of SAP solution Manager key require for SAP ECC6 Installation. For training and education purpose we have created Solution Manager Key for different servers Like server, server1 a ... .jpg) How to activate your new Service Data Control Center, SAP Solution Manager
How to activate your new Service Data Control Center, SAP Solution Manager
How to activate your new Service Data Control Center, SAP Solution Manager The new Service Data Control Center –Scenario Without a SAP Solution Manager system- Local Activation of the new Servic ...- Security checks in the SAP EarlyWatch Alert
The SAP EarlyWatch Alert report contains selected checks about "Security". These checks are described in this note. 1. SAP Security Notes: ABAP and Kernel Software Corrections & ... .jpg) Define Business Blueprint SAP Solution Manager 3.1
Define Business Blueprint SAP Solution Manager 3.1
Define Business Blueprint SAP Solution Manager 3.1 Back to the Solution Manager Tutorial. Before we enter the second module of the course, let me direct you to the step descriptions in the botto ...- Post-processing with a system copy of the SAP Solution Manager
Post-processing with a system copy of the SAP Solution Manager After the system copy, obsolete data must be deleted in the new system. In the target system of the system copy, delete the entries ... - Grey Metrics for JAVA Instance
We have grey metrics for JAVA instance in technical monitoring workcenter. for different causes and depending on the error message the solution is also different. 1. We cannot connect to service ... - SAP Solution Manager Module Certification Cost and Course Duration in India
SAP Solution Manager CoursesThe following topics are covered as a part of SAP Solution Manager Course: Basic Set-up Steps Application Incident Management IT Service Management Specific Customizing Cha ...  Steps in solman_setup cannot be opened
While opening steps in solman_setup the Internet Explorer hangs sometimes thus I cannot open the steps of solman_setup in order to configure the system.Solution:The issue is caused because the In ....jpg) System Landscape: Working with Attributes, Solution Manager
System Landscape: Working with Attributes, Solution Manager
The “System Landscape: Working with Attributes” tutorial.After completing the session you will have a good overview of: Creating attributes Set-up possible entries (F4) help for attributes ... SDCC_OSS Ping Failed
Error CausedBecause of SDCCN task is having a connection issue with the SAP back-end system. The ping gets failed to SDCC_OSSFollow the below steps to re-generate the issue: Transaction code SDCCN Don ...- Function of REFRESH_ADMIN_DATA_FROM_SUPPORT Job
What is the purpose of the batch job REFRESH ADMIN DATA FROM SUPPORT? SOLUTION This job reads information of various categories from the SAP Support Portal and saves these informations loca ... - Configure the P4S port with Solution Manager 7.2
How to configure the P4S port with Solution Manager 7.2?While switching the Diagnostics Agent to MS/P4S it switches automatically back to the previous setting.I cannot configure the Diagnostics A ...  Add search criteria options in CRM UI
How to add search criteria options in CRM_UI? The Web UI does not offer search options in the new version (Solution Manager 7.1). The search option was present in the previous version of Solution Mana ...